Information

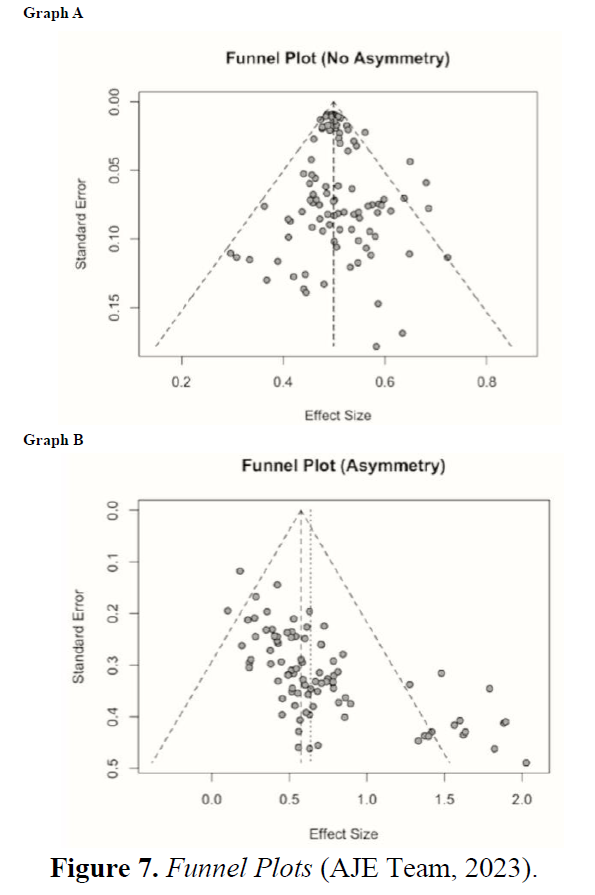
Funnel plots serve as a visual tool for assessing publication bias, with any asymmetry in the plot potentially indicating bias. Additionally, statistical tests such as Egger's regression test or Begg's test can be employed to identify publication bias.
Sensitivity analysis involves conducting the meta-analysis under different assumptions or excluding specific studies to ascertain the robustness of the results. For instance, researchers may opt to exclude lower-quality studies or those with extreme effect sizes to evaluate the consistency of overall conclusions (Blackhall & Ker, 2007).
Funnel plots and Egger's Test are powerful tools in assessing and addressing biases in meta-analytical estimates. However, it's important to note that the trim-and-fill method, while useful, has its limitations. Sensitivity analyses are crucial in understanding and mitigating biases, and researchers should approach these methods with caution and awareness of potential challenges (AJE Team, 2023).
The funnel plot, a technique used to evaluate the possibility of publication bias (Harbord et al., 2006), is based on the premise that smaller studies, despite their size, play a significant role in detecting publication bias. The probability of publication bias affecting smaller studies is higher than that of more extensive studies. This detectable difference is attributable to the disparity in susceptibility to publication bias. If a researcher completes a large, randomized trial, they are likely to want to see it published even if the result is negative because of the effort involved. However, for minor experiments, the scenario might vary. If publication bias exists, it is most likely due to small negative trials not being published. This underscores the importance of smaller studies in the detection of publication bias, making the process more engaging and interesting for researchers.
The funnel plot, a visual depiction of trial sizes plotted against the effect size they present, serves as a tool to assess publication bias. As the trial size increases, trials are likely to converge around the true underlying effect size. One would expect an even scattering of trials on either side of this true underlying effect (Fig. 7 - Graph A). When publication bias has occurred, one expects an asymmetry in the scatter of small studies, with more studies showing a positive result than those showing a negative result (Fig. 7 - Graph B).
Funnel plot asymmetry can be visually evaluated using the funnel plot, but the following methods are used to quantify it.:
In conclusion, meta-analysis represents a potent quantitative method that amalgamates findings from multiple studies to yield more resilient conclusions. Researchers can derive more precise and generalizable insights through systematic data collection, effect size estimation, model selection, heterogeneity assessment, and publication bias scrutiny. Despite its strengths, meticulous planning and execution are imperative in meta-analysis to circumvent biases and misinterpretations. When rigorously conducted, it furnishes invaluable contributions to evidence-based practice and policymaking across diverse scientific domains.
