Information

While not explicitly designed to identify publication bias, forest plots are commonly used in meta-analyses to visually present the individual study effect sizes and confidence intervals (AJE Team, 2023; Harrer et al., 2021)*.
The role of forest plots in promoting transparency and reproducibility is significant, as they allow researchers to use the spread and distribution of the effect sizes to evaluate whether there is a shortage of smaller studies with null or negative results, which might indicate potential publication bias. This key function of forest plots underscores their importance in research. Forest plots are the typical method for displaying meta-analyses. They visually present the observed effect, confidence interval, and typically the weight of each study. Additionally, they show the combined effect we computed in a meta-analysis. This enables others to promptly assess the accuracy and range of the included studies and the relationship between the combined effect and the observed effect sizes.
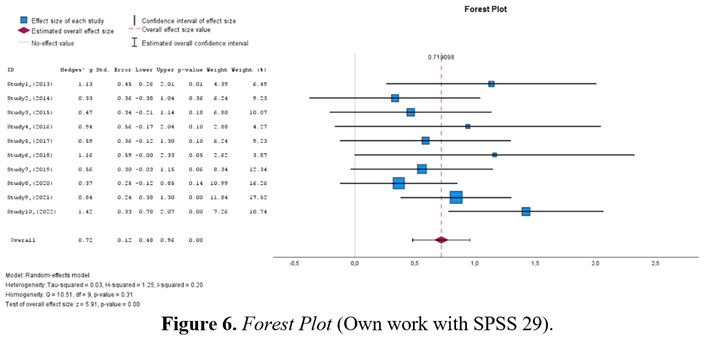
Figure 4 provides a visual representation of the primary elements of a forest plot. On the left side of the forest plot, individual study tests, as well as the overall heterogeneity and effect size values, are presented in a user-friendly visual format.
A visual depiction on the right side illustrates the effect size of each study, typically positioned at the centre of the plot. This graphical representation illustrates the study's point estimate of the effect size on the x-axis, serving as a crucial indicator of the effect size. The point estimate is accompanied by a line that depicts the confidence interval range calculated for the observed effect size. This line visually represents the uncertainty associated with the point estimate. Remember that the point estimate is typically represented by a square, with the size of the square being determined by the weight of the effect size; studies with a larger weight (7th, 8th, and 9th) are depicted by a larger square, while studies with lower weight have a smaller square. A conventional forest plot should also include the effect size data used in the meta-analysis to allow others to replicate our results.
Forest plots are commonly utilized in meta-analyses to represent individual study effect sizes and confidence intervals visually. Researchers can identify potential publication bias by examining the spread and distribution of effect sizes. These plots provide a graphical display of observed effects, confidence intervals, and the weight of each study, offering a quick way to assess the precision and spread of included studies and how the pooled effect relates to the observed effect sizes (Harrer et al., 2021). Additionally, the main components of a forest plot are illustrated, providing an overview of the individual study tests and effect size values. Furthermore, the point estimate of a study is visualized along with a line representing the confidence interval. The size of the square around the point estimate reflects the weight of the effect size. It is also conventional for a forest plotto contain the effect size data used in the meta-analysis, allowing others to replicate the results.

* You can view the meta-analysis results in SPSS in Appendix 1.