EN | PT | TR | RO | BG | SR
;
Marked as Read
Marked as Unread


NEXT TOPIC

CONTENT OF THE UNIT


PART III. PUBLICATION BIAS AND QUALITY ASSESSMENT


What are the potential biases associated with publication bias in meta-analyses?

Publication bias arises when studies with significant or positive results are more likely to be published than those with inconclusive or negative results, potentially distorting meta-analytical findings.

If a meta-analysis fails to use up-to-date methods, it can be as misleading as a good meta-analysis enlightens policymakers and researchers. A fundamental issue is publication selection bias and 'p-hacking ', which refers to manipulating data analysis until it produces statistically significant results, compromising the truthfulness of the findings. Out of the 107,000 meta-analyses published in 2022, more than half do not discuss publication bias at all. Because publication bias or p-hacking can easily exaggerate the typical reported effect size by two or more, meta-analyses that ignore publication bias may cause more harm than good (Irsova et al., 2023).

The exclusion of unpublished studies in systematic reviews may lead to the exclusion of critical evidence and result in biased, overly positive outcomes. This is a significant concern, as prior studies have suggested that meta-analyses that do not consider grey literature could overstate the effectiveness of interventions, potentially leading to misguided policies and ineffective interventions.

Numerous sophisticated methods with robust theoretical underpinnings have recently been developed to address publication selection bias. These approaches have been validated through extensive Monte Carlo simulations and are applicable in numerous studies. The Trim and Fill technique, Egger's regression test, and the Copas selection model are among these methods. Recent advancements also encompass the management of observed and unobserved systematic heterogeneity within the framework of model uncertainty and certain types of p-hacking*. Together, these method advances constitute essential steps forward in understanding and interpreting contemporary research.

When conducting a meta-analysis, it is crucial to consider various sources of Bias that can impact the study's conclusions. This thorough approach is essential to ensure the validity and reliability of the findings. The common sources of Bias to be mindful of include:

  • Selection Bias: This can occur when studies or participants are not selected randomly, leading to a skewed population representation.
  • Reporting Bias, also known as publication bias, arises when available results systematically differ from missing results, often favouring significant, positive outcomes.  
  • Performance Bias and Detection Bias: These biases can affect the implementation and outcomes of interventions in studies, influencing the results.
  • Attrition Bias: This Bias occurs when there is a differential loss of participants from the study groups, potentially impacting the validity of the findings.
  • Omitted Variable Bias: This Bias can lead to distorted average estimates in a meta-analysis, particularly when correcting for the wrong Bias.
  • Publication bias in meta-analyses can introduce a range of potential biases, as demonstrated by the following insights from academic abstracts. These biases, which can significantly impact the validity and generalization of conclusions in the field, are a key research focus.
  • Publication Bias Influence: The influence of publication bias on meta-analytic results is a critical issue that cannot be overstated. It can potentially suppress unfavourable studies, thereby biasing results towards artificially favourable outcomes, a concern that research must address.
  • Detection Methods: Various statistical tests have been proposed to detect publication bias, but their effectiveness depends on their assumptions about the cause, leading to varying power across different scenarios. Although publication bias is acknowledged in meta-analyses, there is a pressing need for formal assessment and correction of its effects. Currently, only a small percentage of meta-analyses attempt to address publication bias, highlighting the urgency of this issue.
  • Impact on Validity: The prevalence of potential publication bias in meta-analyses, particularly in specific disciplines, raises concerns about the validity and generalization of conclusions.
  • Methodological Challenges: Standard meta-analysis methods are vulnerable to Bias due to incomplete reporting of results and poor study quality, and there are no clear guidelines for assessing this Bias.
  • Test Limitations: Some tests for publication bias, such as Egger's test and weighted regression tests, may have inflated Type I error rates or low statistical power, especially in the presence of heteroscedasticity. The phenomenon happens when research studies with statistically significant findings are published more frequently than those with non-significant results. It is crucial to keep in mind that this could cause an overestimation of the actual effect size.

Following Harrer et al. (2021 and Page et al. (2021), it is important to understand that several other factors can distort the evidence in our meta-analysis. These factors can have a significant impact and include:

  1. Citation bias occurs when studies with negative or inconclusive findings, even if published, are less likely to be referenced by other related literature. This can make it more challenging to identify these studies through reference searches.
  2. Time-lag bias: Studies with positive results are often published earlier than those with unfavourable findings. This means that findings of recently conducted studies with positive findings are often already available, while those with non-significant results are not.
  3. Multiple publication bias: The results of "successful" studies are more likely to be reported in several journal articles, which makes it easier to find at least one of them. Reporting study findings across several articles is also known as "salami slicing."
  4. Language bias: In most disciplines, the primary language in which evidence is published is English. Publications in other languages are less likely to be detected, especially when the researchers need translation to understand the contents. The possibility of Bias exists when studies in English systematically differ from those published in other languages.
  5. Outcome reporting bias: Many studies and experimental designs, in particular, measure more than one outcome of interest. Some scientists take advantage of this by only disclosing the results supporting their hypothesis and disregarding those not confirming it. This can also lead to Bias: Technically speaking, the study has been published, but its (unfavourable) result will still be missing in our meta-analysis because it is not reported.


* The manipulation of data analysis until it produces statistically significant results, compromising the truthfulness of the findings


It is important to note that while some degree of bias is nearly inevitable in studies, understanding these biases and their manifestations in study designs is crucial to mitigate their impact on the conclusions of a meta-analysis. Publication bias can distort meta-analyses by amplifying effects requiring identification and correction. To mitigate the influence of publication and reporting bias, as well as questionable research practices (QRPs), various techniques can be employed in meta-analyses. These approaches encompass methods for study search as well as statistical methods:

  1. Study search: If publication bias exists, this step is crucial because it means that a search of the published literature may yield data that is only partially representative of all the evidence. We can counteract this by searching for grey literature, including dissertations, preprints, government reports, or conference proceedings. Fortunately, pre-registration is also becoming more common in many disciplines. This makes it possible to search study registries for studies with unpublished data and ask the authors if they can provide data that has not been made public (yet). Grey literature search can be tedious and frustrating, but it is worthwhile. One large study has found that including grey and unpublished literature can help avoid overestimating the true effects.
  2. Statistical methods: Statistical procedures can also examine the presence of publication. It is important to note that none of these methods can directly pinpoint publication bias. However, they can scrutinise particular properties of the data that might serve as potential indicators of its presence. Some methods can also quantify the true overall effect when correcting for publication bias.


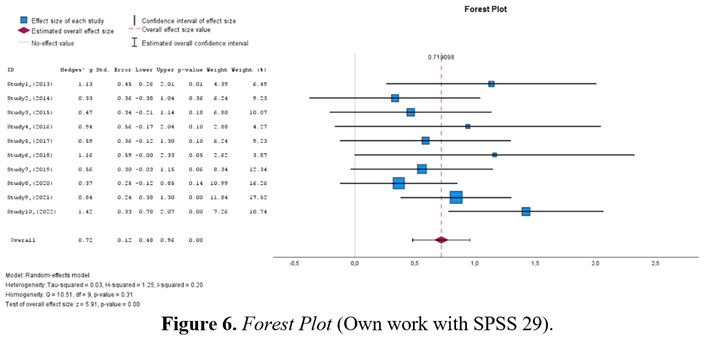
While not explicitly designed to identify publication bias, forest plots are commonly used in meta-analyses to visually present the individual study effect sizes and confidence intervals (AJE Team, 2023; Harrer et al., 2021)*.

The role of forest plots in promoting transparency and reproducibility is significant, as they allow researchers to use the spread and distribution of the effect sizes to evaluate whether there is a shortage of smaller studies with null or negative results, which might indicate potential publication bias. This key function of forest plots underscores their importance in research. Forest plots are the typical method for displaying meta-analyses. They visually present the observed effect, confidence interval, and typically the weight of each study. Additionally, they show the combined effect we computed in a meta-analysis. This enables others to promptly assess the accuracy and range of the included studies and the relationship between the combined effect and the observed effect sizes.

Figure 4 provides a visual representation of the primary elements of a forest plot. On the left side of the forest plot, individual study tests, as well as the overall heterogeneity and effect size values, are presented in a user-friendly visual format.

A visual depiction on the right side illustrates the effect size of each study, typically positioned at the centre of the plot. This graphical representation illustrates the study's point estimate of the effect size on the x-axis, serving as a crucial indicator of the effect size. The point estimate is accompanied by a line that depicts the confidence interval range calculated for the observed effect size. This line visually represents the uncertainty associated with the point estimate. Remember that the point estimate is typically represented by a square, with the size of the square being determined by the weight of the effect size; studies with a larger weight (7th, 8th, and 9th) are depicted by a larger square, while studies with lower weight have a smaller square. A conventional forest plot should also include the effect size data used in the meta-analysis to allow others to replicate our results.

Forest plots are commonly utilized in meta-analyses to represent individual study effect sizes and confidence intervals visually. Researchers can identify potential publication bias by examining the spread and distribution of effect sizes. These plots provide a graphical display of observed effects, confidence intervals, and the weight of each study, offering a quick way to assess the precision and spread of included studies and how the pooled effect relates to the observed effect sizes (Harrer et al., 2021). Additionally, the main components of a forest plot are illustrated, providing an overview of the individual study tests and effect size values. Furthermore, the point estimate of a study is visualized along with a line representing the confidence interval. The size of the square around the point estimate reflects the weight of the effect size. It is also conventional for a forest plotto contain the effect size data used in the meta-analysis, allowing others to replicate the results.

* You can view the meta-analysis results in SPSS in Appendix 1.


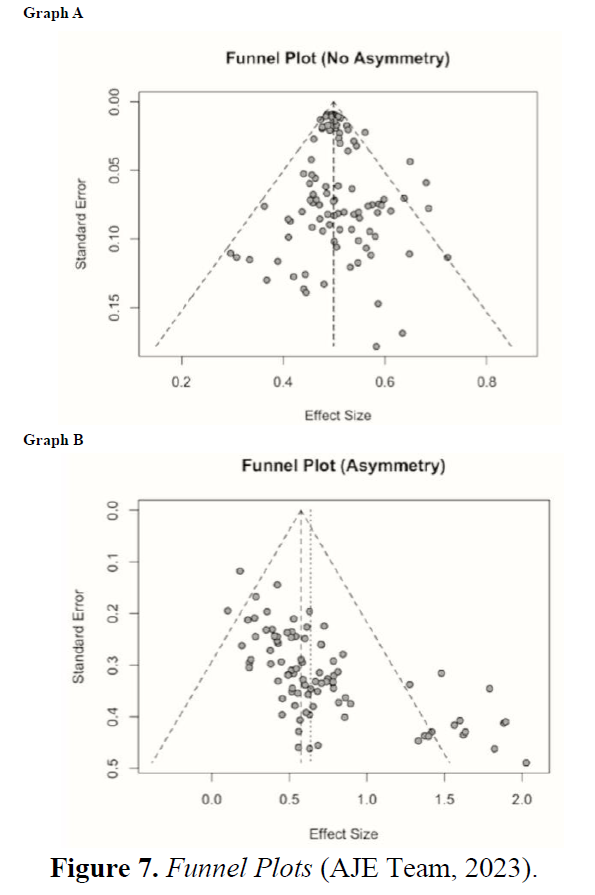
Funnel plots serve as a visual tool for assessing publication bias, with any asymmetry in the plot potentially indicating bias. Additionally, statistical tests such as Egger's regression test or Begg's test can be employed to identify publication bias.

Sensitivity analysis involves conducting the meta-analysis under different assumptions or excluding specific studies to ascertain the robustness of the results. For instance, researchers may opt to exclude lower-quality studies or those with extreme effect sizes to evaluate the consistency of overall conclusions (Blackhall & Ker, 2007).

Funnel plots and Egger's Test are powerful tools in assessing and addressing biases in meta-analytical estimates. However, it's important to note that the trim-and-fill method, while useful, has its limitations. Sensitivity analyses are crucial in understanding and mitigating biases, and researchers should approach these methods with caution and awareness of potential challenges (AJE Team, 2023).

The funnel plot, a technique used to evaluate the possibility of publication bias (Harbord et al., 2006), is based on the premise that smaller studies, despite their size, play a significant role in detecting publication bias. The probability of publication bias affecting smaller studies is higher than that of more extensive studies. This detectable difference is attributable to the disparity in susceptibility to publication bias. If a researcher completes a large, randomized trial, they are likely to want to see it published even if the result is negative because of the effort involved. However, for minor experiments, the scenario might vary. If publication bias exists, it is most likely due to small negative trials not being published. This underscores the importance of smaller studies in the detection of publication bias, making the process more engaging and interesting for researchers.

The funnel plot, a visual depiction of trial sizes plotted against the effect size they present, serves as a tool to assess publication bias. As the trial size increases, trials are likely to converge around the true underlying effect size. One would expect an even scattering of trials on either side of this true underlying effect (Fig. 7 - Graph A). When publication bias has occurred, one expects an asymmetry in the scatter of small studies, with more studies showing a positive result than those showing a negative result (Fig. 7 - Graph B).

Funnel plot asymmetry can be visually evaluated using the funnel plot, but the following methods are used to quantify it.:

  1. Egger’s Test (Egger et al., 1997): This test involves weighted regression analysis of the effect size estimates on their precision measures (i.e., standard errors). The focus is on the intercept line, indexed by b. A statistically significant intercept (with p < 0.05) suggests publication bias.
  2. Rank correlation Begg test: Establishes if a notable relationship exists between the rankings of standardized effect sizes and the rankings of their variances.

In conclusion, meta-analysis represents a potent quantitative method that amalgamates findings from multiple studies to yield more resilient conclusions. Researchers can derive more precise and generalizable insights through systematic data collection, effect size estimation, model selection, heterogeneity assessment, and publication bias scrutiny. Despite its strengths, meticulous planning and execution are imperative in meta-analysis to circumvent biases and misinterpretations. When rigorously conducted, it furnishes invaluable contributions to evidence-based practice and policymaking across diverse scientific domains.


Familiarity with the methodological framework of meta-analysis is essential to assess its validity in achieving research objectives.

What are the potential consequences of publication bias on the validity of meta-analyses? Publication bias can significantly impact the validity of meta-analyses in several ways:

  • Influence on Meta-Analytic Results: Publication bias can suppress unfavourable studies, biasing meta-analytic results towards an artificially favourable direction.
  • Detection Challenges: Various statistical tests have been proposed to detect publication bias. However, they often make different assumptions and may have low power in many cases, making it challenging to select the optimal test for real-world meta-analyses.
  • Low Rates of Assessment: A review of meta-analyses in plastic surgery and psychology journals revealed low rates of proper publication bias assessment, with only a small percentage attempting to correct for its effect.
  • Impact on Conclusions: Studies have shown that publication bias can lead to overestimated effects and false-positive results, affecting the validity of meta-analytic conclusions.
  • Detection Method Limitations: P value–driven tests for publication bias may underestimate its presence, mainly when the number of studies in the meta-analysis is small.

In conclusion, publication bias can have significant consequences on the validity of meta-analyses, including biasing results, impacting conclusions, and posing challenges for detection. The low rates of proper assessment and the limitations of detection methods further emphasize the need for careful consideration of publication bias in meta-analytic research.