Conducting an initial search is a crucial step that validates the proposed concept, prevents duplication of previously discussed topics, and confirms an adequate number of articles for analysis. This process is not just a formality but a significant contribution to the field (Tawfik et al., 2019).
Having established the protocol and scoping, the next step is a meticulous full search. It will generate numerous studies, but many will be discarded as irrelevant using criteria based on the study's title, abstract, or place of publication. The remaining 'potentially relevant' studies must be read more closely and divided into relevant and irrelevant. This process can lead to a significant reduction in the number of papers at each step. Be prepared for a large number (often the majority) of studies that you initially identify as relevant to be unsuitable for the meta-analysis. The final step is to extract the necessary information (effect sizes and moderators) from relevant papers. A finalised data spreadsheet is crucial, ensuring all the information you want to extract is included.
It is essential to understand the trade-off between building up a pile of relevant papers and returning to them to extract effect size once you have a finalised data spreadsheet versus extracting data from a paper as you read it. The advantage of the former is that you can be more confident that your spreadsheet contains all the information you want to extract. The latter's advantage is that you can read a paper in depth once.
Understanding exactly how a study was designed and which relevant data are needed to extract an effect size can be surprisingly complex. Good note-taking is essential in this process and often no easier on a second reading. Suppose you are confident that you have a good understanding of the main features of the relevant studies. In that case, you might consider designing a database and extracting data as soon as you classify a paper as relevant. The caveat is that you might still have to return to these papers if you later discover that you must encode an additional moderator term or adjust your study inclusion criteria. Extracting information on the initial reading is most feasible when dealing with studies that closely follow a specific and commonplace experimental design.
Papakostidis and Giannoudis (2023) draw attention to the fact that, despite the last trend for quality improvement in recent years, methodological deficiencies have been found in currently published meta-analyses. Systematic reviews and meta-analyses should conform to strict and transparent rules, such as the PRISMA (Preferred Reporting Items for Systematic Reviews and Meta-Analyses) guidelines (see Fig. 4), ensuring the reproducibility and robustness of the search process, the reliability and validity of their findings and the clarity of reporting. These guidelines outline the basic steps to ensure all the requirements mentioned above are met, including the transparent reporting of the search strategy, study selection process, data extraction, and data synthesis:
- A prospective study protocol is the cornerstone of a systematic review and meta-analysis. Its role in reducing bias and ensuring transparency cannot be overstated. This well-structured and succinct document should adequately describe all steps through the research process, including potential changes in the systematic review methodology. Doing so justifies these changes and prevents the introduction of bias in the selection of data for the review.
- The search process is not just a step but the backbone of a systematic review and meta-analysis. Its robust and reproducible nature ensures all relevant data from eligible studies are included. This involves searching multiple electronic databases and reference lists, with databases like PubMed, EMBASE, or SCOPUS being essential. Additional databases such as Cochrane, Web of Science, and ProQuest should also be considered. It is also worth identifying potentially relevant grey literature by searching conference proceedings' abstracts. However, inadequate search strategies and language restrictions can limit the number of eligible studies, introducing a significant amount of publication bias. This bias is even possible with the most comprehensive search strategy, as the failure to publish entire studies or all outcomes from a study is expected.
- Internal validity of the primary studies: The term "internal validity" refers to the ability of a study to establish a reliable cause-and-effect relationship between a treatment and an outcome by limiting various confounders. It is a crucial aspect closely tied to the risk of bias and methodological quality of the included studies. Several tools have been developed to evaluate the risk of bias in primary studies, both for RCTs (randomised controlled trials) and observational studies.
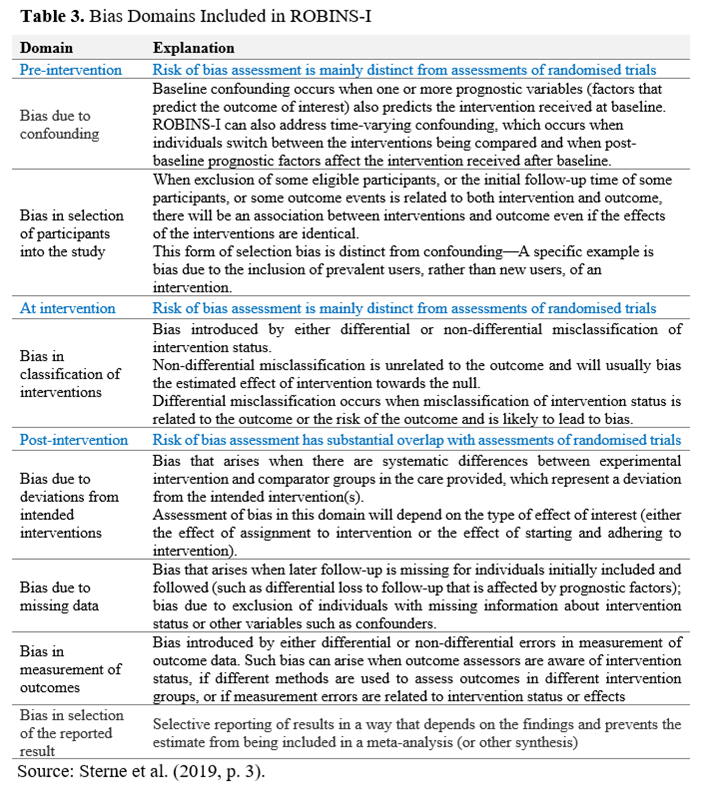
- The latest edition of the Cochrane Collaboration Risk-of-Bias tool (RoB-2)* provides a framework for assessing the risk of bias in the results of RCTs. It is structured into five domains of potential bias introduction into the study findings: (1) randomisation process; (2) deviations of intended interventions; (3) missing outcome data; (4) measurement of the outcome; (5) selection of the reported results (Sterne et al., 2019). Within each bias domain, specific signalling questions aim to elicit information relevant to the risk of bias assessment**. The tool includes algorithms that map responses to these signalling questions onto a proposed risk-of-bias judgement for each domain. The possible risk-of-bias judgements are (1) Low risk of bias, (2) Some concerns, and (3) High risk of bias. The tool is depicted as a "traffic lights" display. The Risk of Bias in Non-randomised Studies of Interventions (ROBINS-I) tool outlines seven domains of potential bias occurrence (see Table 3): two in the "pre-intervention" phase, one in the "at intervention" phase, and four in the "post-intervention" phase.
- Data Analysis and Reporting: While combining data from individual studies increases sample size and statistical power, it's crucial to explore the presence of statistical heterogeneity. This inconsistency in the treatment effect across the included studies can be misleading and reduce confidence in the conclusions. Quantifying the statistical heterogeneity is usually based on specific statistical tests (Higgins-I, Cochran Q-test). Authors of meta-analyses must explore the presence of statistical heterogeneity by adequately designing and performing sub-group and sensitivity analyses based on a prior hypothesis at the inception of the study protocol. Such hypotheses involve exploring the pooled analysis results into potentially more homogeneous data subsets (subgroups) based on, for example, clinical characteristics of samples, methodological issues, study design, and geographical origin of studies. Two different statistical models are used to produce combined effect estimates. The selection of the appropriate statistical model for pooling data depends on the presence of heterogeneity between the studies. However, clear cut-off values of the degree of heterogeneity have not been defined that would dictate the selection of one model over the other.
On the other hand, the statistical tests for heterogeneity are often underpowered for detecting significant heterogeneity:
- The fixed-effects model assumes a single true effect size across all studies, represented by the pooled effect estimate. This model is typically used when there is no heterogeneity in a meta-analysis and when there are many studies with large sample sizes. In such cases, there is confidence that the test for heterogeneity is powerful enough to detect significant differences. The results obtained using this model tend to have narrower confidence intervals. If there are concerns about heterogeneity, the random-effects model (DerSimonian & Kacker, 2007) is considered a better choice. It produces wider confidence intervals around the point estimates and is a more cautious option for the analysis. In the medical field, where the true effect is expected to vary across different populations, using the random effects model more frequently is more appropriate. The use of the fixed-effects model is reasonable in meta-analyses that include a sufficiently large number of studies with adequate sample sizes and where statistical heterogeneity has yet to be detected. Finally, the quality of the summarised evidence obtained from a meta-analysis should be evaluated using the transparent framework of the GRADE, AMSTAR or PRISMA tool (see Fig. 4). They assess the confidence in the effect estimate for each outcome of interest. Not using them in meta-analyses could result in a lack of transparency and potentially lead to misleading conclusions.
- The random-effects model assumes that the actual effect estimate differs among the original studies because of differences in their clinical characteristics. Therefore, the combined effect size estimate generated based on this model represents an average estimate of all the individual studies' estimates.
- Analysing the outcomes of a meta-analysis. It is essential to analyse the results of a meta-analysis, considering their significance. A statistically significant variance is not meaningful if it lacks relevance. Additionally, any difference can achieve statistical significance with a sufficiently large sample size. Conversely, when a non-significant overall effect estimate is calculated, it is essential to carefully assess whether what is considered relevant falls within the confidence interval of this estimate.
- Validating the results is a significant step. Evidence centres such as the CEBM at Oxford University, a renowned institution in the field, develop necessary evaluation tools. They are instrumental in establishing the trustworthiness, scientific significance, and applicability of the collected evidence from a meta-analysis. With five key questions, CEBM is a reliable method to determine the validity of the study's findings.
* https://methods.cochrane.org/bias/resources/rob-2-revised-cochrane-risk-bias-tool-randomized-trials
** See Table 1, in https://www.bmj.com/content/366/bmj.l4898.long
