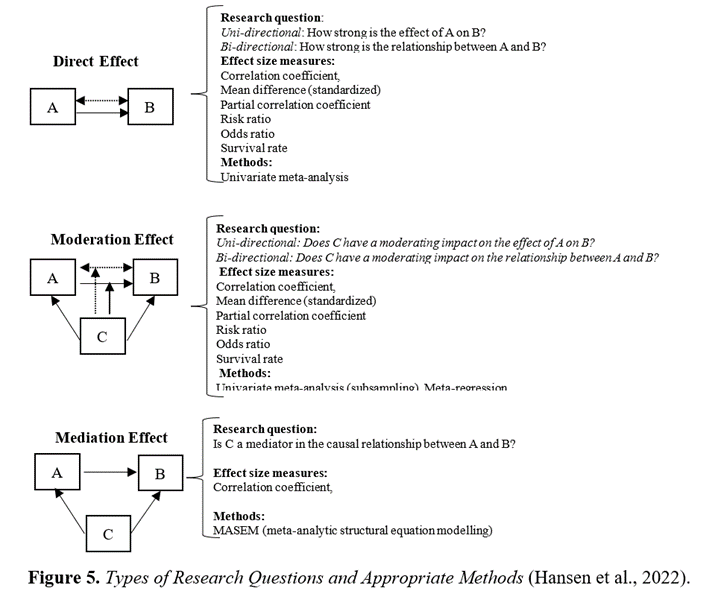
Step 1: Identifying Potential Moderators
Potential moderators should be selected based on theoretical grounds, previous empirical findings, and practical relevance. These could include demographic characteristics (e.g., age, gender), methodological factors (e.g., study quality, sample size), or intervention specifics (e.g., dosage, duration).
Step 2: Coding Moderators
Systematically extract and code information about potential moderators from each study included in the meta-analysis. This involves creating a detailed coding sheet where each study is evaluated and assigned values for each moderator.
Step 3: Assessing Heterogeneity
Before conducting moderator analysis, assessing the presence and extent of heterogeneity in the effect sizes is essential. This can be done using several statistical measures:
- Cochran's Q Test: Assesses whether observed variability in effect sizes is greater than expected by chance. Q is the weighted sum of squares on a standardized scale. It is reported to have a P value with low P-values, indicating the presence of heterogeneity. This test, however, is known to have low power to detect heterogeneity, and it is suggested that a value of 0.10 be used as a cut-off for significance. Conversely, Q has too much power as a heterogeneity test if the number of studies is large. A significant Q test suggests the presence of heterogeneity.
- I² Statistic: It is the percentage of observed total variation across studies that is due to real heterogeneity rather than chance. It is calculated as I2 = 100% x (Q - df)/Q, where Q is Cochran's heterogeneity statistic and df is the degrees of freedom. Negative values of I2 are put equal to zero so that I2 lies between 0% and 100%. It measures the fraction of overall variation in effect sizes attributed to differences rather than random sampling errors. Values range from 0% (no heterogeneity) to 100% (substantial heterogeneity).
- Tau-squared (τ²): Estimates the variance of true effect sizes across studies in a random-effects model.
High heterogeneity may warrant subgroup analyses or meta-regression to explore potential moderators, such as study design, sample characteristics, or intervention specifics (Jak, 2015).


