EN | PT | TR | RO | BG | SR
;
Marked as Read
Marked as Unread


NEXT TOPIC

CONTENT OF THE UNIT


PART II. METHODS OF CONDUCTING A META-ANALYSIS


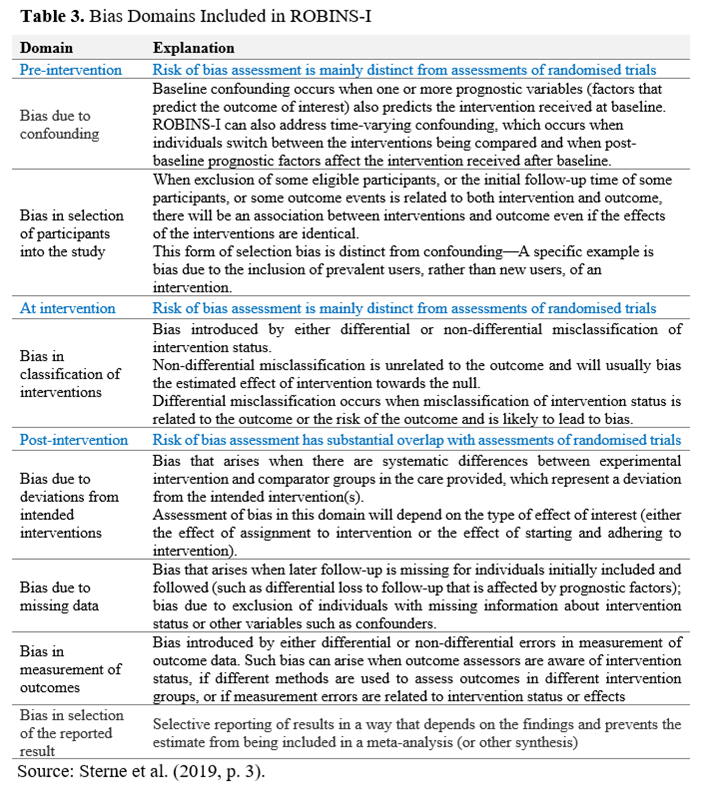
Globally, a meta-analysis starts by formulating the research questions. The research questions should be tested based on the published studies. The published studies need sufficient information to calculate the effect sizes, which is essential for a meta-analysis. Comprehensive inclusion and exclusion criteria are established to determine which studies qualify for inclusion in the meta-analysis. Once the effect sizes and study characteristics are gathered, the data can undergo statistical analysis. The subsequent step involves interpreting the results and preparing reports to share the findings (Cheung, 2015).

Conducting a meta-analysis entails predefined eligibility criteria, exposure variables, primary and secondary outcomes of interest, and an analysis plan. Proper indications and methodologies, minimising bias risk, and avoiding misleading conclusions are important. Meta-analysis is acknowledged as the optimal approach for objectively assessing and studying the evidence pertaining to a specific issue, furnishing a high level of evidence and contributing to the advancement of knowledge.

Sen and Yildirim (2022) organise the mandatory process of a meta-analysis into the following steps:

  • Formulating the Research Question and Team: The process begins with developing a straightforward research question and assembling a research team.
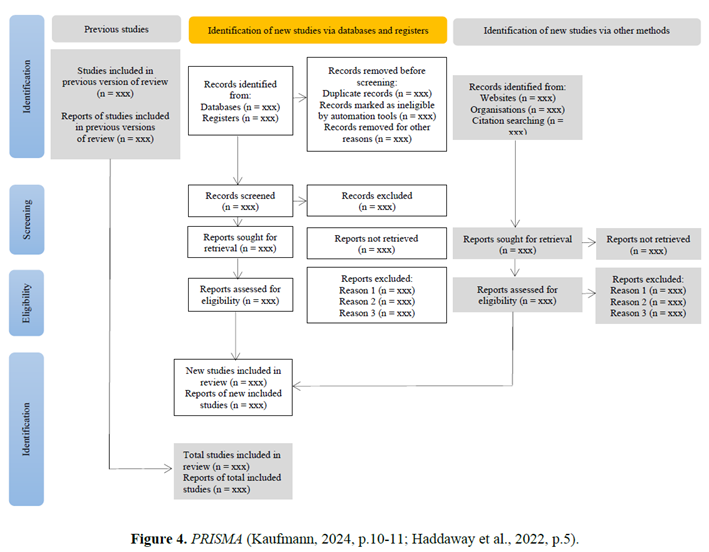
  • Designing and Executing a Search Strategy: A systematic search strategy is crucial to finding all available evidence from published and unpublished sources.
  • Screening and Extracting Data: A decision should be made on selecting appropriate studies from the collected studies. Relevant studies are screened, and data is extracted from these studies.
  • Critical Appraisal and Analysis: Quality control/sensitivity analyses should be conducted. Each study should be critically appraised for potential biases, and the evidence should be assessed and analysed.
  • The effect size for the chosen studies must be determined and computed separately for each study.
  • The data needs to be pooled, and a summary statistic and a confidence interval must be computed.
  • Additional analyses (heterogeneity, publication bias) should be done.
  • Moderator analyses for moderator variables should be performed.
  • Interpret the results and draw conclusions (inferences) based on them. Reporting and Disseminating Findings: The steps mentioned above should be reported together with the meta-analysis findings.

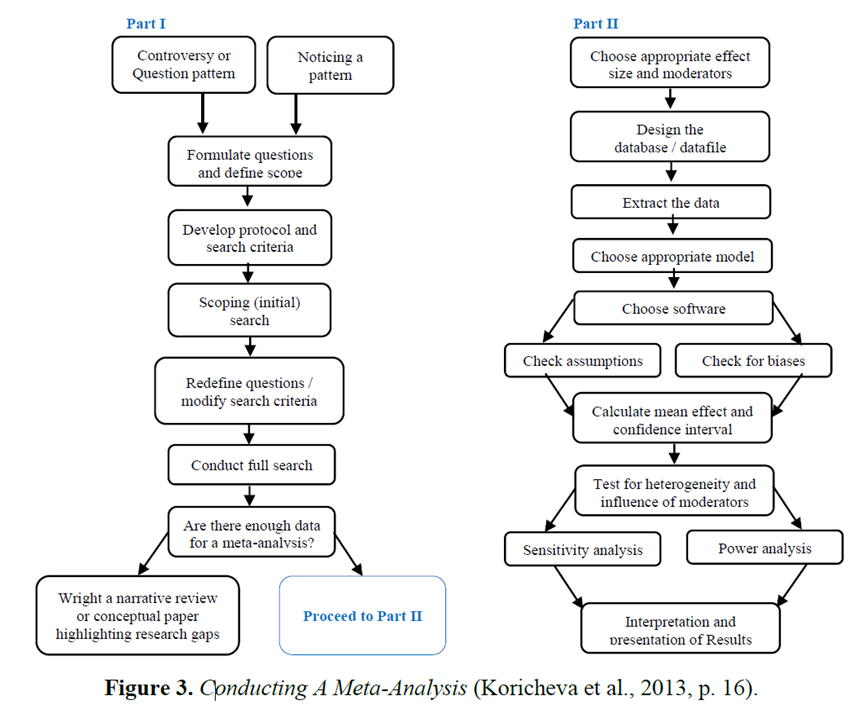
Figure 3 depicts the beginning phase of developing a question and methodically searching for relevant studies in the primary literature (Part I), as well as the phase where you gather data from publications, conduct statistical analyses, and present and explain your findings (Part II).

Meta-analysis methods have advanced notably over the last few years (Irsova et al., 2023). Performing a meta-analysis is conceptually no different from an empirical study because sometimes statistical problems bog you down. However, researchers usually design a study with their statistical abilities in mind or follow an established design that allows them to replicate a standard analytic approach. The difference between a good and a bad empirical study often boils down to whether an interesting question is being asked and the quality and quantity of the data collected using an unbiased sampling technique. The same principles apply to meta-analysis, where recently developed techniques allow for solid conclusions even when facing challenges in the underlying empirical literature (Irsova et al., 2023).

Despite the linear appearance of the process outline (Fig. 2), there is often uncertainty leading to certain steps being repeated. During Part I, the researcher may find it necessary to iterate through multiple cycles of scoping searches, adjusting study questions, and modifying the protocol and search criteria until confident that a comprehensive search will yield the desired results. A short description of what each step involves each step in the process.


When developing a research question for a systematic review or meta-analysis, it is essential to ensure it is feasible, interesting, novel, ethical, and relevant. To examine a theoretical hypothesis, one must have studies that use experiments to test for causality (Tawfik et al., 2019). It is crucial to distinguish between studies reporting an observed relationship and those identifying relationships through experimental manipulation. Combine observational and experimental data to test a consistent relationship between variables. Consider the scope of generalization and the size of the data set you can handle.

Focusing on questions within your area of expertise is helpful for more accessible research. The main questions typically revolve around the mean effect, differences from the null expectation, and explaining outcome variation among different studies. Group studies are based on the population studied, the methodology used, how the outcome is measured, and the comparison baseline. However, many moderators should be avoided, as it can lead to low statistical power.

Lastly, it is crucial to be aware of confounded moderators and to decide how to address them in your analyses. This is not just a suggestion but a responsibility for conducting research. Being diligent in this aspect ensures the accuracy and validity of your research results.in your analyses, as this ensures the accuracy and validity of your research results (Koricheva et al., 2013).


Once you have formulated your questions, you need to write up a protocol that will (1) formally specify the questions you intend to ask, (2) specify an objective search strategy, and (3) establish study inclusion criteria (Davis et al., 2021; Gurevitch et al., 2018; Koricheva et al., 2013).

Specifying the questions you intend to ask will include being specific about potential sources of heterogeneity in effect sizes (Côté & Jennions, 2013).

Specifying an objective search strategy entails not biasing data collection toward relevant papers you are already familiar with; otherwise, this could affect the outcome as it is often easier to remember papers with significant results. Primarily, this involves making a list of which electronic databases you will search and what search terms you will use. Secondarily, an objective search strategy will include deciding how much effort is required to search for “gray literature.” For example, will you write to colleagues asking for unpublished data, and if so, who and why?

Once you have conducted a search and compiled a list of potential papers, you must establish study inclusion criteria. These criteria are often fairly obvious and include the following:

  1. Does the study fit the scope of your questions?
  2. Does the methodology fit with how your question is defined?
  3. If so, was it of sufficient magnitude or duration?
  4. Does the study contain extractable data? Is there sufficient information to extract an effect size, variance, and the sample size used?
  5. Your inclusion criteria will sometimes have to consider study quality. This is far more difficult to assess than the above criteria, but it can be just as important.

It is worth noting, however, that as in primary research, your protocol for searching the literature and extracting effect sizes will almost certainly be modified as you proceed. The reality is that, in many respects, your final protocol will end up describing what you did rather than what you ideally wanted to do. First, you must tell the reader how you collected your data. So, just as in primary research, you provide the reader with enough information on data collection and analysis to allow your review to be repeated and updated in the future. Second, you must have a protocol that forces you to evaluate continually whether your sampling is biased.

A protocol increases the objectivity with which you compile data, but it should not blind you to the reality that the process of meta-analysis involves numerous subjective decisions; these are most apparent when trying to decipher the results of a given paper and deciding whether you can extract the necessary data for your synthesis (Côté & Jennions, 2013). If more than one person collects the data, a well-described and tested protocol ensures uniformity in data extraction and coding decisions about moderators.


Sometimes, if you are confident that most studies will be confined to a few key sources, you might only search a limited set of journals. This was how almost all research syntheses were done before online databases. No one uses this approach anymore because of the explosion of data accessibility (at least for those with access to scientific journals). However, whether to delve into unpublished or “gray” sources remains important (Gurevitch et al., 2018; Koricheva et al., 2013).

Remember that during a scoping search, try to find only some studies or obtain a preliminary estimate of the mean effect. The main goals are to:


a. Consider estimating the amount of data available to help you make informed decisions about expanding or focusing your study questions. This can really improve your research.

b. Work out what factors vary among studies that you might encode as potential moderators.

c. Decide what criteria mark a study as irrelevant (e.g., if your search identifies 2000 papers to read in full, you will have to make some exclusion decisions based on the title, abstract, and place of publication);

d. Work out what criteria each potentially relevant study must fulfil before you try to extract an effect size.

e. Establish the format of your data extraction form/spreadsheet and

f. Decide upon the most suitable measures of outcome (effect sizes).

This last decision will often depend on whether data are reported as a relationship between two continuous variables, in which case the effect size r is the most popular choice in ecology and evolution. Alternatively, the decision may involve comparing two groups, in which case there is a range of options depending on whether the response variable is discrete or continuous. It is sometimes most straightforward to conduct separate meta-analyses, dividing studies based on the most appropriate effect size.


Conducting an initial search is a crucial step that validates the proposed concept, prevents duplication of previously discussed topics, and confirms an adequate number of articles for analysis. This process is not just a formality but a significant contribution to the field (Tawfik et al., 2019).

Having established the protocol and scoping, the next step is a meticulous full search. It will generate numerous studies, but many will be discarded as irrelevant using criteria based on the study's title, abstract, or place of publication. The remaining 'potentially relevant' studies must be read more closely and divided into relevant and irrelevant. This process can lead to a significant reduction in the number of papers at each step. Be prepared for a large number (often the majority) of studies that you initially identify as relevant to be unsuitable for the meta-analysis. The final step is to extract the necessary information (effect sizes and moderators) from relevant papers. A finalised data spreadsheet is crucial, ensuring all the information you want to extract is included.

It is essential to understand the trade-off between building up a pile of relevant papers and returning to them to extract effect size once you have a finalised data spreadsheet versus extracting data from a paper as you read it. The advantage of the former is that you can be more confident that your spreadsheet contains all the information you want to extract. The latter's advantage is that you can read a paper in depth once.

Understanding exactly how a study was designed and which relevant data are needed to extract an effect size can be surprisingly complex. Good note-taking is essential in this process and often no easier on a second reading. Suppose you are confident that you have a good understanding of the main features of the relevant studies. In that case, you might consider designing a database and extracting data as soon as you classify a paper as relevant. The caveat is that you might still have to return to these papers if you later discover that you must encode an additional moderator term or adjust your study inclusion criteria. Extracting information on the initial reading is most feasible when dealing with studies that closely follow a specific and commonplace experimental design.

Papakostidis and Giannoudis (2023) draw attention to the fact that, despite the last trend for quality improvement in recent years, methodological deficiencies have been found in currently published meta-analyses. Systematic reviews and meta-analyses should conform to strict and transparent rules, such as the PRISMA (Preferred Reporting Items for Systematic Reviews and Meta-Analyses) guidelines (see Fig. 4), ensuring the reproducibility and robustness of the search process, the reliability and validity of their findings and the clarity of reporting. These guidelines outline the basic steps to ensure all the requirements mentioned above are met, including the transparent reporting of the search strategy, study selection process, data extraction, and data synthesis:

  1. A prospective study protocol is the cornerstone of a systematic review and meta-analysis. Its role in reducing bias and ensuring transparency cannot be overstated. This well-structured and succinct document should adequately describe all steps through the research process, including potential changes in the systematic review methodology. Doing so justifies these changes and prevents the introduction of bias in the selection of data for the review.
  2. The search process is not just a step but the backbone of a systematic review and meta-analysis. Its robust and reproducible nature ensures all relevant data from eligible studies are included. This involves searching multiple electronic databases and reference lists, with databases like PubMed, EMBASE, or SCOPUS being essential. Additional databases such as Cochrane, Web of Science, and ProQuest should also be considered. It is also worth identifying potentially relevant grey literature by searching conference proceedings' abstracts. However, inadequate search strategies and language restrictions can limit the number of eligible studies, introducing a significant amount of publication bias. This bias is even possible with the most comprehensive search strategy, as the failure to publish entire studies or all outcomes from a study is expected.
  3. Internal validity of the primary studies: The term "internal validity" refers to the ability of a study to establish a reliable cause-and-effect relationship between a treatment and an outcome by limiting various confounders. It is a crucial aspect closely tied to the risk of bias and methodological quality of the included studies. Several tools have been developed to evaluate the risk of bias in primary studies, both for RCTs (randomised controlled trials) and observational studies.
  4. The latest edition of the Cochrane Collaboration Risk-of-Bias tool (RoB-2)* provides a framework for assessing the risk of bias in the results of RCTs. It is structured into five domains of potential bias introduction into the study findings: (1) randomisation process; (2) deviations of intended interventions; (3) missing outcome data; (4) measurement of the outcome; (5) selection of the reported results (Sterne et al., 2019). Within each bias domain, specific signalling questions aim to elicit information relevant to the risk of bias assessment**. The tool includes algorithms that map responses to these signalling questions onto a proposed risk-of-bias judgement for each domain. The possible risk-of-bias judgements are (1) Low risk of bias, (2) Some concerns, and (3) High risk of bias. The tool is depicted as a "traffic lights" display. The Risk of Bias in Non-randomised Studies of Interventions (ROBINS-I) tool outlines seven domains of potential bias occurrence (see Table 3): two in the "pre-intervention" phase, one in the "at intervention" phase, and four in the "post-intervention" phase.
  5. Data Analysis and Reporting: While combining data from individual studies increases sample size and statistical power, it's crucial to explore the presence of statistical heterogeneity. This inconsistency in the treatment effect across the included studies can be misleading and reduce confidence in the conclusions. Quantifying the statistical heterogeneity is usually based on specific statistical tests (Higgins-I, Cochran Q-test). Authors of meta-analyses must explore the presence of statistical heterogeneity by adequately designing and performing sub-group and sensitivity analyses based on a prior hypothesis at the inception of the study protocol. Such hypotheses involve exploring the pooled analysis results into potentially more homogeneous data subsets (subgroups) based on, for example, clinical characteristics of samples, methodological issues, study design, and geographical origin of studies. Two different statistical models are used to produce combined effect estimates. The selection of the appropriate statistical model for pooling data depends on the presence of heterogeneity between the studies. However, clear cut-off values of the degree of heterogeneity have not been defined that would dictate the selection of one model over the other.

On the other hand, the statistical tests for heterogeneity are often underpowered for detecting significant heterogeneity:

  1. The fixed-effects model assumes a single true effect size across all studies, represented by the pooled effect estimate. This model is typically used when there is no heterogeneity in a meta-analysis and when there are many studies with large sample sizes. In such cases, there is confidence that the test for heterogeneity is powerful enough to detect significant differences. The results obtained using this model tend to have narrower confidence intervals. If there are concerns about heterogeneity, the random-effects model (DerSimonian & Kacker, 2007) is considered a better choice. It produces wider confidence intervals around the point estimates and is a more cautious option for the analysis. In the medical field, where the true effect is expected to vary across different populations, using the random effects model more frequently is more appropriate. The use of the fixed-effects model is reasonable in meta-analyses that include a sufficiently large number of studies with adequate sample sizes and where statistical heterogeneity has yet to be detected. Finally, the quality of the summarised evidence obtained from a meta-analysis should be evaluated using the transparent framework of the GRADE, AMSTAR or PRISMA tool (see Fig. 4). They assess the confidence in the effect estimate for each outcome of interest. Not using them in meta-analyses could result in a lack of transparency and potentially lead to misleading conclusions.
  2. The random-effects model assumes that the actual effect estimate differs among the original studies because of differences in their clinical characteristics. Therefore, the combined effect size estimate generated based on this model represents an average estimate of all the individual studies' estimates.
  3. Analysing the outcomes of a meta-analysis. It is essential to analyse the results of a meta-analysis, considering their significance. A statistically significant variance is not meaningful if it lacks relevance. Additionally, any difference can achieve statistical significance with a sufficiently large sample size. Conversely, when a non-significant overall effect estimate is calculated, it is essential to carefully assess whether what is considered relevant falls within the confidence interval of this estimate.
  4. Validating the results is a significant step. Evidence centres such as the CEBM at Oxford University, a renowned institution in the field, develop necessary evaluation tools. They are instrumental in establishing the trustworthiness, scientific significance, and applicability of the collected evidence from a meta-analysis. With five key questions, CEBM is a reliable method to determine the validity of the study's findings.


* https://methods.cochrane.org/bias/resources/rob-2-revised-cochrane-risk-bias-tool-randomized-trials

** See Table 1, in https://www.bmj.com/content/366/bmj.l4898.long


Higgins et al. (2023) consider four critical points in this regard:


a. As review authors, researchers will likely encounter various outcome data types in your work. These include dichotomous, continuous, ordinal, count or rate, and time-to-event data. By familiarising these types, you can enhance your understanding of the research process and feel more empowered.

b. When comparing outcome data between two intervention groups ('effect measures'), there are many methods for each data type. Comparisons of binary outcomes can utilise a risk ratio, an odds ratio, a risk difference, or a number needed to treat. Continuous outcomes, on the other hand, can be compared using a mean difference or a standardised mean difference. This diversity of methods enriches researchers' comprehension of the research process.

c. Effect measures come in two types: ratio measures (risk ratio and odds ratio) or difference measures (such as mean difference and risk difference). Ratio measures are usually analysed using a logarithmic scale.

d. Information obtained from research reports might require conversion into a consistent or usable format for analysis.


It is challenging to state the number of studies required for a meta-analysis. Factors affecting the decision may involve discipline-specific context, fixed or random-effects models used in the analysis, population values of effect sizes, and other considerations (Cheung & Vijayakumar, 2016). Designing a database is an art; a well-designed one can instil a sense of preparedness and confidence in you.

The basic rules are the same as those for an empirical study; you should ensure the datasheet contains all the information you need and is set out logically so that it is easy to complete and difficult to enter data in the wrong place. Use the most extended, most complicated-looking papers you have to trial test your datasheet. If it can handle them, you are off to a good start.

The main difference between an empirical study and a meta-analysis is that you must record which subjects you did and did not collect data from. In short, keep a bibliographic library of studies and explain why some were excluded (e.g., irrelevant, missing critical information needed to satisfy inclusion criteria, not possible to extract an effect size and variance estimate).

A suitable protocol makes it relatively easy to encode information for study moderators. It provides a structured approach that simplifies the process, making it more manageable. In contrast, extracting effect sizes is among the most challenging parts of meta-analysis. It can lead to self-doubt, especially during your first meta-analysis. To extract effect sizes, you often must make subjective decisions. This process requires careful consideration and thoroughness to ensure the accuracy of your analysis.

Finally, a protocol should be established for studies reporting multiple effect sizes. Specifically, if treatment effects, which are the changes in the outcome of interest due to the treatment, are measured repeatedly over time, a structured approach will help you determine which comparisons to use, providing a sense of guidance and control.


In conducting meta-analyses, it is imperative to possess a comprehensive comprehension of the subject matter. This may entail engaging in primary research, authoring an exhaustive narrative literature review, or demonstrating extensive pedagogical experience. Should the need for a co-author from the sub-field arise, it is essential to engage a collaborator with similar expertise. If a meta-analysis on the topic is extant, it is incumbent upon the researcher to substantiate the added value of their meta-analysis. This may hinge on factors such as the absence of accommodation for publication bias or heterogeneity in the original meta-analysis. The mere proliferation of new primary studies does not suffice as a justification (Irsova et al., 2023).

Furthermore, it is imperative to exhibit a substantial methodological advancement vis-à-vis the original meta-analysis. Superficial updates are best left as pedagogical exercises or the purview of artificial intelligence. Notwithstanding, exceptions to these guidelines may be warranted when significant advancements in research approaches and methodologies have cast doubt on the robustness of prior meta-analytic findings. Additionally, structural shifts within societies may have rendered previous effect sizes non-representative.

Based on your knowledge of the topic, assemble a list of five primary studies you must include in the meta-analysis. You may enlist a large language model to ensure you have selected the five most important studies. But be careful about relying too much on artificial intelligence since current models often provide factually incorrect results; always double-check and prioritise your expertise. Then, design your main search query using Google Scholar. We prefer Google Scholar to other databases because it includes all papers that have appeared online and allows you to go through the full text of papers, not just the title, abstract, and keywords. This flexibility in search query design empowers you to tailor your search to your specific needs. Using a single main query for a universal database makes it easier for other researchers to replicate your meta-analysis. Remember that Google Scholar's algorithms are subject to change, so depending on your topic, it might be beneficial to use an additional database to strengthen your approach. Use different combinations of the keywords employed in primary studies.

If the five most critical primary studies identified above are among the first hits, you will know that your query is reasonably well prepared. Spend several days fine-tuning the query (improving the percentage of highly relevant primary studies returned among the first 50 hits) and paying attention to the correct search syntax.

Fig. 4 describes the PRISMA standard to guide your search and selection and report your results (Haddaway et al., 2022; Kaufmann & Reips, 2024).


All co-authors must gather data for meta-analysis yourselves; it cannot be outsourced to research assistants. In the future, artificial intelligence (GPT 7?) will be capable of assisting with this time-consuming task. However, at present, there is no alternative to the authors of the meta-analysis, who, as specialists in the field, are uniquely qualified to review each primary study meticulously and methodically construct their dataset manually, one data point at a time (Irsova et al., 2023).
Unlike the authors of most econometric studies, meta-analysts do not take existing data but create new databases*. 

At least two co-authors must gather the data independently. This rigorous process, while time-consuming, is crucial for ensuring the reliability of the meta-analysis. Mistakes can be expected when manually coding studies (which often consist of dozens of pages in PDF format), and having two experts collect the data allows for easy identification and correction of errors. The effect sizes gathered for meta-analysis should be comparable qualitatively and quantitatively. This means that not only should the same estimated sign indicate an effect in the same direction, but it should also be meaningful to compare the actual sizes of the effects across primary studies.

Effect sizes that are quantitatively comparable include correlation coefficients, odd ratios, elasticities, dollar values, and standardised mean differences. Regression coefficients are generally only comparable quantitatively with further transformations because different primary studies can use different units of measurement or functional forms of the independent and dependent variables. An exception is represented by regressions in which variables on both sides are used in logarithms, and, therefore, the regression yields estimated elasticities.

Collecting all estimates reported in the primary studies is imperative. This approach is recommended for five reasons (Irsova et al., 2023):

  1. It provides a comprehensive view, ensuring that no information is discarded and eliminating the need for subjective judgment. This comprehensive approach to data collection gives the researchers confidence in the thoroughness of their analysis. You can always present a meta-analysis of the corresponding subsample of the dataset to give greater weight to the estimates preferred by the authors.
  2. An exclusive analysis like this can confirm the strength of the results or establish a starting point. However, disregarding other estimates is unjustified even in the latter scenario.
  3. When conducting original research, extra verifications are expected to guarantee the accuracy of the findings. Occasionally, the researchers themselves consider these findings less reliable. By incorporating all the findings, it is possible to assess whether the "inferior" results differ consistently from those favoured by the authors.
  4. When conducting a best-practice meta-analysis, it is still appropriate to give greater weight to the authors' preferred results. At times, it is challenging to determine objectively which results favour the author. However, collecting and analysing all the findings can empower the researchers to make informed decisions without the need for subjective judgments.

It is important to examine any outliers and influential points in your data. One method is creating a funnel plot, a scatter plot of effect sizes and their precision. Suppose you notice data points that significantly deviate from the main funnel shape or raise concerns in DFBETA (a method for measuring the influence of individual data points on regression analysis)**.

In that case, reviewing the primary studies associated with those data points is advisable. This review will help ensure that there are no errors in the data or the primary studies, and it may also reveal nuances in how the studies were conducted, making their results incomparable to the rest of the research literature. If there are still uncertainties, reaching out to the authors of the primary studies can provide clarity. It is crucial to address any influential or leverage points identified by DFBETA, as they can heavily impact the results of your meta-analysis. This may involve correcting or excluding these points as a last resort. Additionally, it is not just recommended, it's essential that robustness checks be reported to show the impact of removing outliers or employing winsorisationn (replace observations above and below a certain centile with the value of that centile) on the data (Zigraiova et al., 2020). Ultimately, your results should be driven by reliable and influential research findings, and if this is the case, the prominence of these findings should be justified in detail.

Finally, ensure that apart from effect sizes and standard errors, you also gather information on significant differences in the context where the estimated effect sizes were obtained. Most meta-analyses should gather at least ten variables (often dummy binary variables which take the value 0 or 1) reflecting differences in data, methods, and publication characteristics. Depending on the size and complexity of the database, more variables may be needed, but it is advisable to keep the number below 30 for simplicity. For instance, consider if the primary study's experiment focuses on a representative sample of the population or only on a specific group, the country where it was conducted, whether a placebo or an alternative treatment was assigned to the control group, publication date, impact factor of the outlet, and the number of yearly citations received.

Before collecting data, prepare a list of variables to code carefully. This can be the most challenging and creative part of a meta-analysis. The number of potential variables is nearly unlimited, so selecting the most important ones is essential based on discussions in the literature and your expertise. A comprehensive language model can help identify some of the dimensions in which primary studies vary. However, it's crucial to remember that double-checking is vital, as artificial intelligence can sometimes provide misleading results. This caution and attention to detail will ensure the accuracy of your meta-analysis.

Consider including additional information that complements what you collect from primary studies. This comprehensive approach, which goes beyond the primary studies, can provide a more thorough understanding of the research context. For example, if the primary studies were conducted in various countries, including country (or region) characteristics might be valuable as additional variables. Experiment results can be influenced by factors such as temperature, humidity, or the country's financial development, which might be impossible to analyse by individual primary studies alone. Considering and including such additional information can make your meta-analysis more comprehensive and insightful (Irsova et al., 2023).

* Examples of meta-analysis datasets are available at https://www.meta-analysis.cz/.

** See https://blogs.sas.com/content/iml/2019/06/17/influence-regression-dfbeta.html


Mastering the art of meta-analysis may seem straightforward, but achieving excellence in this field is truly challenging. Determining effect sizes is one of the most daunting aspects of conducting a meta-analysis.

The first step in a meta-analysis involves systematic literature review and data extraction. Researchers use database searches, reference lists, and expert consultations to identify relevant studies. Inclusion and exclusion criteria are applied to ensure that only studies addressing the research question and meeting quality standards are included.

By combining data from various sources, meta-analysis can increase statistical power, provide more precise estimates of effect sizes, and identify patterns or moderators across studies. This essay explores the quantitative methods used in meta-analysis, including data collection, effect size estimation, model selection, and assessment of heterogeneity (Haddaway et al., 2022).

The focus of any meta-analysis is the effect size, which measures the strength of how one variable or group of variables influences another. Effect sizes are crucial for understanding the impact of experimental treatments or the relationship between variables in nonexperimental studies. However, calculating effect sizes can be challenging due to the wide range of research designs and the inadequate reporting of statistical information in primary research reports. The d and r measures are commonly used and practical for calculating effect sizes, providing researchers with valuable tools for meta-analysis.

Once relevant studies are identified, extracting and standardising effect sizes is next. The effect size is a numerical measure that indicates the strength of the experimental outcome. Common effect size metrics include:

  1. Cohen's d: Measures the difference between two means divided by the pooled standard deviation.
  2. Odds Ratio (OR): Used in binary outcomes to measure the odds of an event occurring in one group compared to another.
  3. Correlation Coefficient (r): Analyse the intensity and orientation of the connection between two variables.

Standardisation of effect sizes is crucial because it allows the combination of results from studies that use different scales or outcome measures.


Please remember that There are two distinct aggregation models: fixed effects and random effects models. The fixed effects model presupposes that all studies in the meta-analysis come from the same population and that the true effect size remains consistent across all studies. Thus, the variation in effect size is presumed to stem from differences within each study, such as sampling error. In contrast, the random effects model is more intricate if the effects on the population vary from study to study. This assumption is based on the idea that the observed studies are a selection of samples drawn from a broader universe of studies. Random effects models encompass two sources of variation in a given effect size: within and between studies. (Kaufmann & Reips, 2024).

When conducting meta-analyses, effect sizes are combined using either fixed-effect or random-effects models. The choice to utilize one of these models relies on the assumption about the distribution of the effect sizes:

  1. Fixed-Effect Model: This model assumes that all studies estimate the same true effect size and that observed variations are due to sampling error alone. It gives more weight to more extensive studies and is appropriate when studies are very similar regarding participants, interventions, and outcomes.
  2. Random-Effects Model: This model assumes that effect sizes vary across studies due to both within-study sampling error and between-study heterogeneity. It incorporates an additional variance component, allowing for a more generalized inference about the effect size. The random effects model will likely produce a more cautious estimate with a wider confidence interval, prompting a mindful approach to the results. However, the conclusions from the two models typically align when there is no heterogeneity. It is more appropriate when there is significant heterogeneity among the included studies.