EN | PT | TR | RO | BG | SR
;
Marked as Read
Marked as Unread

1. Introduction


1.1. Key Concepts of Structural Equation Modeling


In this section, the basic concepts of Structural Equation Modeling are explained.


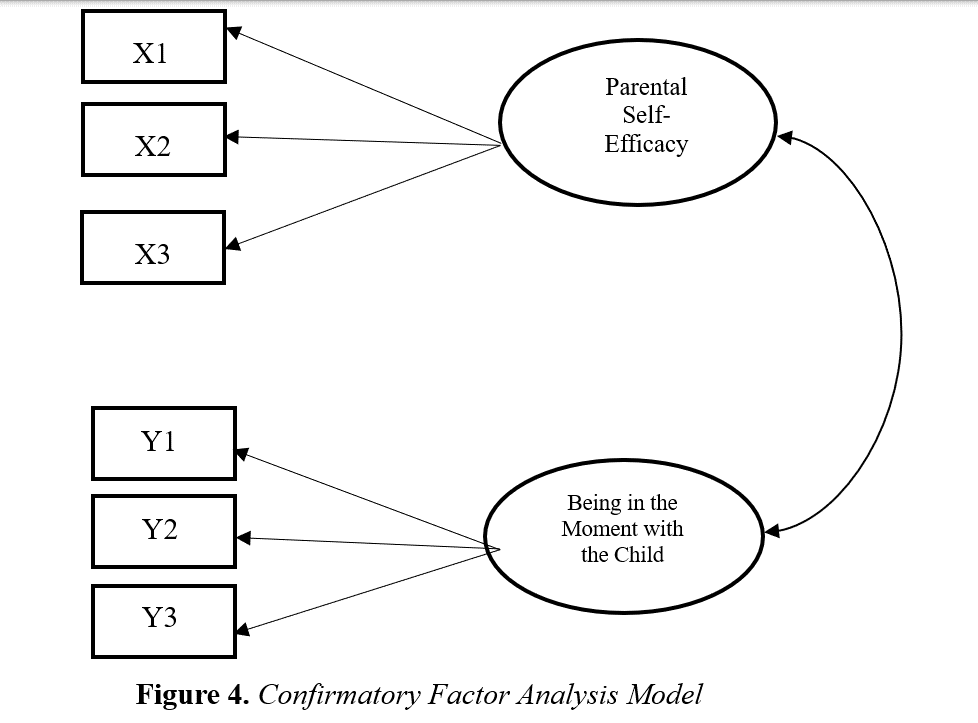
Characteristics like attitudes, IQ, personality traits, and socioeconomic status that are not directly observable are referred to as latent variables in the social and behavioral sciences (Yuan & Bentler, 2007). Ellipses are used as a visual representation of latent variables in AMOS analysis. It is necessary to establish measurable behaviors that are assumed to reflect this latent variable because latent variables can not be directly assessed. Thus, observed variables are used to gather information on latent variables. Observed variables, also known as indicator variables, are visually represented by rectangles or squares (Schreiber et al., 2006). Scales used in research to measure a certain emotion, thought or behavior are examples of observed variables. For example, Mindfulness in Marriage Scale (Erus & Deniz, 2018) is a latent variable, and sub-dimensions of the scale formed by the scale items are observed variables that make the latent variable observed. Scale items are brought together to make the concept of mindfulness in marriage observed. Figure 1 shows an example of observed and latent variables.


As seen in Figure 1, MM1 and MM2 sub-dimensions are observed variables and Mindfulness in Marriage is a latent variable. MM1 and MM2 are taken as indicators of Mindfulness in Marriage. Mindfulness in Marriage Scale is unidimensional, but in order to create Structural Equation Modeling, the scale was divided into two sub-dimensions by “parceling method”. If there are no sub-dimensions of a scale, dimensions should be created by parceling method for Structural Equation Modeling. In order to analyze latent variables, the parceling method involves building “item plots” based on the totals of the responses to various items (Russell et al., 1998). An aggregate indication called a parcel is made up of the mean of two or more items, behaviors or answers (Little et al., 2002). There are several techniques for parceling, including exploratory factor analysis (for more information about parceling; see Matsunaga, 2008). Random parceling is one of the easiest ways to constructing parcels. The goal of random parceling is to assign each item to a parcel group at random, without change. There can be two, three, or four parcels constructed, depending on the number of items that need to be assigned (Little et al., 2002). Alternatively, you can take the sum of the even numbered items of the scale as one parcel and the sum of the odd numbered items as the other parcel. It should be noted, however, that a latent variable must have at least two observed variables. However, e1 and e2 are error terms. The influence of measurement error on the observed variables is shown by the one-way arrows linking the error terms to the variables.


Independent (predictor) variables are referred to as exogenous in Structural Equation Modeling, whereas dependent (predicted) variables are called endogenous (Bodoff & Ho, 2016). Figure 2 shows an example of exogenous and endogenous variables in the model.

As seen in Figure 2, the independent variable is “Mindfulness”. This variable is also an exogenous and predictor variable. “Emotion Regulation” is a dependent, endogenous and predicted variable. “Mindfulness in Marriage” is also an endogenous and predicted variable.


For a variable to be a mediator variable, it must meet some requirements. These requirements are as follows (Baron & Kenny, 1986):

  • Changes in the independent variable significantly explain changes in the hypothesized mediator variable,
  • Changes in the mediator variable significantly explain the cause of changes in the dependent variable,
  • A significant relationship between a dependent and independent variable is no longer significant or the strength of the relationship has decreased.

In the model given in Figure 2, “Mindfulness in Marriage” is the mediator variable.

A moderator variable influences the strength and/or direction of the association between an independent or predictor variable and a dependent or predicted variable. Examples of moderator variables include gender, race, and class, whereas quantitative variables include education level (Baron & Kenny, 1986). The model for the moderator variable is given as an example in Figure 3.

In the moderator variable model in Figure 3, “Mindfulness” is the independent variable, “Emotion Regulation” is the dependent variable and “Gender” is the moderator variable. The primary goal of moderator analysis is to determine how the variable chosen as a moderator influences the strength of the link between the dependent and independent variables. In other words, depending on the gender, the correlation between mindfulness and emotion regulation may be stronger or weaker. 


As opposed to being a paradigm for establishing theories, confirmatory factor analysis tests theories. Before to the analysis, a hypothesis must be established for confirmatory factor analysis. Which variables are associated to which factors and which factors are related to each other are determined by this hypothesis and, by extension, by the model (Stapleton, 1997).  Figure 4 presents the confirmatory factor analysis model consisting of two factors. The confirmatory factor analysis model given in Figure 4 aims to confirm the hypothesis that the Mindfulness in Parenting Questionnaire (Aslan Gördesli et al., 2018; McCaffrey et al., 2017) consists of two sub-scale, namely “Parental Self Efficacy” and “Being in the Moment with the Child”.

The figure shows the relationships between the “Parental Self-Efficacy” and “Being in the Moment with the Child” sub-scales and the scale items that constitute these sub-scales. In this model, two sub-scales were shown to be correlated with each other.


Modeling approaches that include measurement errors, multiple concept measurements, and multi-equation models are called structural equation models (Bollen & Noble, 2011). Figure 5 presents the structural equation model consisting of 3 latent variables.

One of the hypotheses for the structural equation model presented in Figure 5 is “Mindfulness in marriage has a mediator role in the relationship between parents’ mindfulness and emotion regulation of their children.” Based on this hypothesis, parents’ mindfulness predicts mindfulness in marriage and mindfulness in marriage predicts emotion regulation of their children. Thus, parents’ mindfulness predicts emotion regulation of their children through mindfulness in marriage. The figure clearly shows the observed and latent variables. For example, “Emotion Regulation” consists of two observed variables, ER and L/N. In other words, Emotion Regulation Checklist (Kapçı et al., 2009; Shields & Cicchetti, 1997) consists of two sub-dimensions. 

The error terms are shown by the one-way arrows in the figure that point to the observed variables. The error terms, e1 and e2, are shown above the latent and dependent variables, mindfulness in marriage and emotion regulation. The error terms represent the effect of the error in the estimation of the latent variable. Each path in the model shows the hypothesis being tested. 

Until this section, general information about Structural Equation Modeling has been presented. In the next section, it will be explained how to conduct Structural Equation Modeling with AMOS software.