Information

A lot of different types and sub-types of observation have developed, and now it has the most complex structure of all data collection procedures.
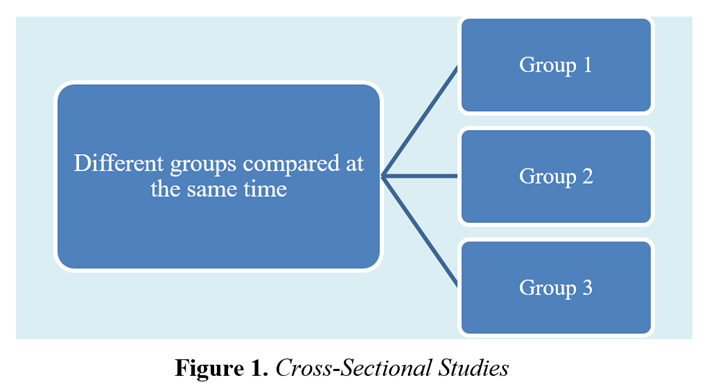
1. Cross-sectional Studies
A cross-sectional study is a type of research that captures information from a population at a single point in time (Figure 1). The information can be obtained from a group of participants with certain characteristics known as variables (e.g. age, gender, origin, education, religion, geographic location, etc). The variables used in a particular study are determined by the research to be carried out, and by the goals of the study. Researchers can use cross-sectional studies to focus on one independent variable, and see how it affects one or more dependent variables. These studies enable researchers to examine several variables at the same time. Cross-sectional studies do not involve the manipulation of variables. They are descriptive studies.
Some examples of cross-sectional studies are given below:

The risk ratio (or rate ratio) is calculated by using the exposure odds ratio (OR):
e.g. OR = (axd)/(cxb).
If OR = 1, then the odds of risk is the same for the exposed and non-exposed.
If OR > 1, then the exposure increases the odds of risk.
If OR < 1, then the exposure reduces the odds of risk.
Example: Сase-control study in medicine
The aim of the research was to examine the connection between the contamination of potable water and potental stomack diseases (e.g. gastritis). The case-study group comprised the people diagnosed with a stomach disease, whereas the control group comprised the people without the disease. During the research, the data on the exposure of the participants to the contaminated potable water were collected, with the focus on the variables such as the source of the water, and duration of the exposure, for each group. The aim was to compare the results in order to determine whether there was a correlation between the water contamination and the risk of developing a stomach disease.
Practice tasks:
Researchers are conducting a case-control study of breast cancer using incident cases. The study includes 100 cases and 100 controls. 70% of the cases report smoking. Among the controls, 50% report smoking.
a) Prepare a 2x2 table with the given data.
b) Calculate the exposure odds ratio.
c) Interpret the exposure odds ratio in a sentence.
Answer:
a)
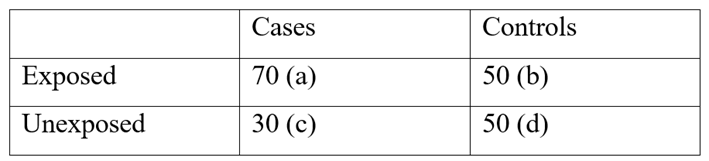
b) Exposure odds ratio = (a/c)/(b/d) = (a*d)/(c*b) = (70*50)/(50*30)=2.33
c) An odds ratio of 2.33 means that the odds of smokers being a case are 2.33 times the odds of non-smokers being a case.