Information

Summary: Introduces the use of Gantt charts as visual tools for project scheduling and monitoring, enabling stakeholders to track progress and manage timelines efficiently.
Learning Objectives:
The chart developed by Henry Gantt, called the Gantt chart, is used in almost all project proposals (Wilson, 2003). This schedule can be generated automatically in programs that allow application through a web platform or system such as Erasmus+.
While the Gantt chart enables the coordinators and partners to easily monitor all activities and processes during the project planning and management stages, it also provides the independent evaluators to make an overall review and evaluation.
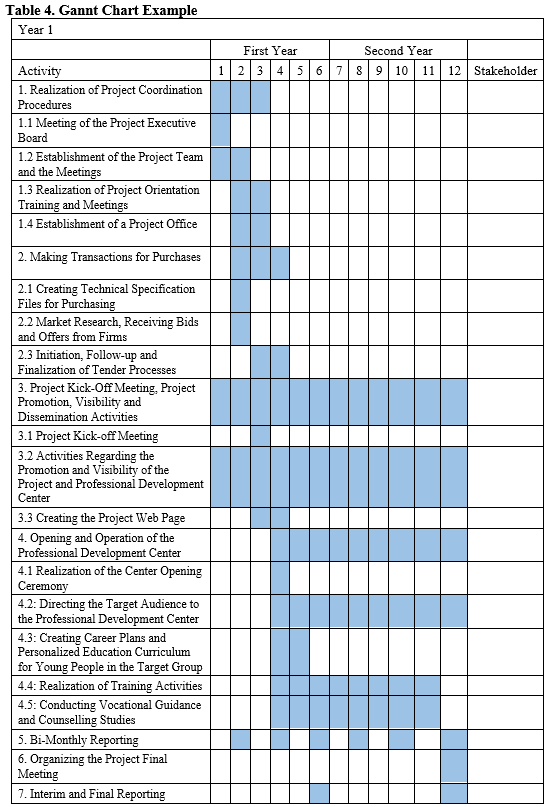
As can be seen in the chart, activities and all sub-activities are located in the left column. The columns on the right show the months of the project. If you anticipate the months in which each activity will take place, you will need to color or mark the relevant parts. In the far right part, you should state who your stakeholders are and who will carry out the activity.