Information

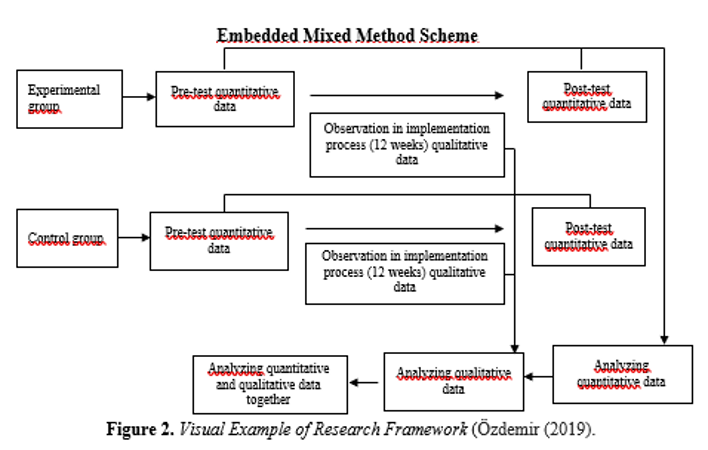
Visual aids like flowcharts, diagrams, or mind maps can make your research framework more accessible. Visual representations allow you to show relationships between different variables and help understand complex structures (Yin, 2018). This framework delineates the academic's journey towards publication, delineating obstacles encountered and potential coping mechanisms, thereby providing readers with a concise overview of the analysis process and facilitating comprehension of various data analysis stages. In this context, the fact that visualization is very helpful in increasing the understandability of the study reveals that visualization should be an instrument that should be frequently used by the researcher. The following Figure 2 provides a “Research Framework” for the "Embedded-Mixed Study Design" among Mixed Methods Research designs.
A scheme may start with the academic's intent to publish, followed by the various obstacles encountered. Arrows can indicate possible coping mechanisms and lead to different outcomes, such as successful publication or withdrawal from the publishing process. This visual aid would provide a snapshot of the complicated analysis process, making it easier for readers to digest the study's analysis stages and different types of data analysis.